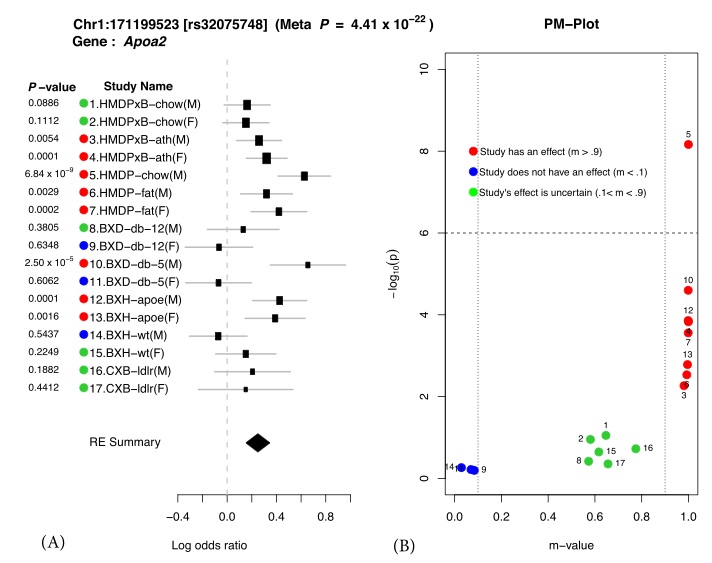
Figure 1. Application of Meta-GxE to Apoa2 locus. The forest plot (A) shows heterogeneity in the effect sizes across different studies. The PM- plot (B) predicts that 7 studies have an effect at this locus, even though only 1 study (HMDP-chow(M)) is genome-wide significant with P-value. doi:10.1371/journal.pgen.1004022.g001
It is well known that both genetic factors and environmental factors contribute to traits and specifically disease risk. In addition, an area of great interest in the research community is the interaction between genetic factors and environmental factors and their contribution to disease risk and other traits. Genetic variants that are involved in gene by environment interactions (denoted GxE) have a different effect on the trait spending on the environment. For example, some variants can have an effect on cholesterol levels only in the presence of a high fat diet. Discovering variants involved in GxE has been tremendously difficult and even though thousands of variants have been implicated in disease related traits using genome wide association studies, very few variants have been implicated in GxEs. Part of the difficulty in detecting GxEs is that the traditional approach requires analyzing studies which contain individuals with multiple environments.
We have recently published a paper with the A. Jake Lusis group in PLoS Genetics which presents a novel approach to discovering GxEs. In our approach, many different studies, each which was performed in different environments, are combined to identify GxEs. The key idea is that if variants have a different genetic effect in different environments, then these variants are candidates for being involved in GxEs. Combining studies together is a statistical technique called meta-analysis which has been a major focus of our lab the past few years. We show in the paper, the mathematically, searching for GxEs using the traditional approach and a type of meta-analysis framework called the random effects model(21565292) are very closely related.
We applied our approach to identify GxEs affected mouse HDL cholesterol by combining 17 mouse studies collected by A. Jake Lusis’ group containing almost 5,000 animals. Our approach discovered 26 loci involved in HDL, many of which appear to be involved in GxE. Virtually all of these loci were not previously discovered in any of the individual studies, but many of them map to genes known to affect HDL. Our approach also includes a visualization framework called a PM-plot which helps interpret the associated loci to help identify GxE interactions(22396665).
From the paper:
Discovering environmentally-specific loci using meta-analysis
The Meta-GxE strategy uses a meta-analytic approach to identify gene-by-environment inter- actions by combining studies that collect the same phenotype under different conditions. Our method consists of four steps. First, we apply a random effects model meta-analysis (RE) to identify loci associated with a trait considering all of the studies together. The RE method explicitly models the fact that loci may have different effects in different studies due to gene-by- environment interactions. Second, we apply a heterogeneity test to identify loci with significant gene-by-environment interactions. Third, we compute the m-value of each study to identify in which studies a given variant has an effect and in which it does not. Forth, we visualize the result through a forest plot and PM-plot to understand the underlying nature of gene-by-environment interactions.
We illustrate our methodology by examining a well-known region on mouse chromosome 1 harboring the Apoa2 gene, which is known to be strongly associated with HDL cholesterol (8332912). Figure 1 shows the results of applying our method to this locus. We first compute the effect size and its standard deviation for each of the 17 studies. These results are shown as a forest plot in Figure 1 (a). Second we compute the P-value for each individual study also shown in Figure 1 (a). If we were to follow traditional methodology and evaluate each study separately, we would declare an effect present in a study if the P-value exceeds a predefined genome-wide significance threshold (P < 1.0×10⁻⁶). In this case, we would only identify the locus as associated in a single study, HMDP-chow(M) (P = 6.84×10⁻⁹). On the other hand, in our approach, we combine all studies to compute a single P-value for each locus taking into account heterogeneity between studies. This approach leads to increased power over the simple approach considering each study separately. The combined meta P-value for the Apoa2 locus is very significant (4.41 × 10⁻²²), which is consistent with the fact that the largest individual study only has 749 animals compared to 4,965 in our combined study.
We visualize the results through a PM-plot, in which P-values are simultaneously visualized with the m-values, which estimates the posterior probability of an effect being present in a study given the observations from all other studies, at each tested locus. These plots allow us to identify in which studies a given variant has an effect and in which it does not. M-values for a given variant have the following interpretation: a study with a small m-value(≤ 0.1) is predicted not to be affected by the variant, while a study with a large m-value(≥ 0.9) is predicted to be affected by the variant.
The PM-plot for the Apoa2 locus is shown in Figure 1 (b). If we only look at the separate study P-values (y-axis), we can conclude that this locus only has an effect in HMDP-chow(M). However, if we look at m-value (x-axis), then we find 8 studies (HMDPxB-ath(M), HMDPxB- ath(F), HMDP-chow(M), HMDP-fat(M), HMDP-fat(F), BxD-db-5(M), BxH-apoe(M), BxH- apoe(F)), where we predict that the variation has an effect, while in 3 studies (BxD-db-12(F), BxD-db-5(F), BxH-wt(M)) we predict there is no effect. The predictions for the remaining 6 studies are ambiguous.
From Figure 1, we observe that differences in effect sizes among the studies are remarkably consistent when considering the environmental factors of each study as described in Table 1. For example, when comparing study 1 – 4, the effect size of the locus decreases in both the male and female HMDPxB studies in the chow diet (chow study) relative to the fat diet (ath study). Thus we can see that when the mice have Leiden/CETP transgene, which cause high total cholesterol level and high LDL cholesterol level, effect size of this locus on HDL cholesterol level in blood is affected by the fat level of diet. Similarly, when comparing study 12 – 15, the knockout of the Apoe gene affects the effect sizes for both male and female BxH crosses. However, in the BxD cross (study 8 – 11), where each animal is homozygous for a mutation causing a deficiency of the leptin receptor, the effect of the locus is very strong in the young male animals, while as animals get older and become fatter, the effect becomes weaker. However in the case of female mice, the effect of the locus is nearly absent at both 5 and 12 weeks of age. Thus we can see that sex plays an important role in affecting HDL when the leptin receptor activity is deficient .
The full citation of our paper is: