Reference-free comparison of microbial communities via de Bruijn graphs

Microbial communities inhabiting the human body exhibit significant variability across different individuals and tissues and are likely play an important role in health and disease. Serghei Mangul and David Koslicki (Oregon State University) recently published a paper presenting a novel approach for characterizing microbial communities in metatranscriptomics studies. Koslicki developed this tool, which may help scientists explore the role microbiota play in disease development, especially when comparing microbiomes of healthy and disease subjects.

Identifying and characterizing the relative abundance of microbiota in different tissues is essential to better understanding the role of microbial communities in human health. Current approaches use reference databases to identify, classify, and compare microbial communities present in the individual host. However, existing databases are incomplete and rely on a limited compendium of reference genomes. Current reference-based approaches are unable to accurately determine microbial compositions to the extent that could be possible given the high resolution of data produced by today’s high throughput sequencing technology.

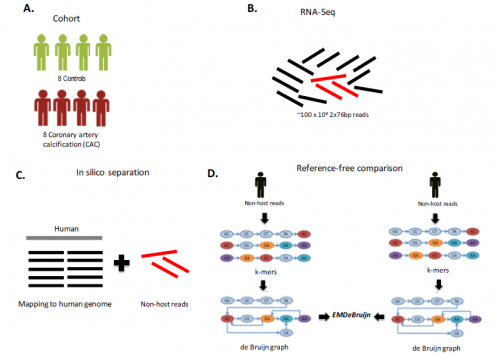
Framework of the study. For more information, download our paper.

Ideally, comparison of microbial communities across samples could circumvent this limiting classification step. Mangul and Koslicki recently developed EMDeBruijn, a reference-free approach that uses all available non-host microbial reads, not just those classified in reference databases, to compare microbial communities.

First, EMDeBruijn translates sequencing data to a de Bruijn graph, which represents overlaps between symbols in sequences. De Bruijn graphs are commonly used in de novo assembly of short read sequences to a genome, but have not yet been applied in a reference-free approach. EMDeBruijn then uses properties of the de Bruijn graphs to compare microbiome composition across individuals. This metric is reduced using the Earth Mover’s Distance (EMD), a statistic that can measure the distance between two probability distributions over a region.

In their recent paper, Mangul and Koslicki applied EMDeBruijn to study the composition and abundance levels of the microbial communities present in blood samples from coronary artery calcification (CAC) patients and controls. EMDeBruijn uses candidate microbial reads to differentiate between case (CAC-affected) and control (healthy) samples, and a filtered set of non-host reads are used to determine the composition of the blood microbiome. Hierarchical clustering using the EMDeBruijn metric successfully identifies several large clusters unique to samples from either health or control groups.

This study indicates the presence of the disease-specific microbial community structure in CAC patients, and points to the need for additional investigation of potentially causal relationships between the microbiome and CAC disease.

Using the same data set, Mangul and Koslicki compare the results of EMDeBruijn with those of current approaches. Existing computational methods, including MetaPhlAn and RDP’s NBC, discovered various microbial communities across the health and control samples. However, neither of these methods were able to identify any disease-specific patterns in the microbiome nor discriminate the samples into disease and healthy groups.

EMDeBruijn provides a powerful, species independent way to assess microbial diversity across individuals and subjects. For more information, see our paper, which was published in the Proceedings of the 7th ACM International Conference on Bioinformatics, Computational Biology, and Health Informatics: http://dl.acm.org/citation.cfm?id=2975174.

Code implementing this method is available at: https://github.com/dkoslicki/EMDeBruijn.

Visualization of the EMDeBruijn Distance. a) Pictorial representation of 2-mer frequencies for two hypothetical samples, S1 and S2. b) The 2-mer frequencies overlaid the de Bruijn graph B2(A ). c) Representation of the flow used to compute EMD2(S1; S2); dark arrows denote mass moved from the initial node to the terminal node. d) Result of applying the flow to the 2-mer frequencies of S1.

This project was a collaboration that started at the Mathematical and Computational Approaches in High-Throughput Genomics program held in Fall 2011 at the Institute of Pure and Applied Mathematics (IPAM). Our on-going Computational Genomics Summer Institute (CGSI; also co-organized by IPAM) was inspired by the 2011 program. Check out the 2017 CGSI website for a preview of this summer’s programs – the deadline for applications is February 1, 2017!

The full citation to our paper is:

Mangul S, Koslicki D. Reference-free comparison of microbial communities via de Bruijn graphs. In Proceedings of the 7th ACM International Conference on Bioinformatics, Computational Biology, and Health Informatics. 2016 Oct 2 (pp. 68-77). Association for Computing Machinery, New York.

Long Single-Molecule Reads Can Resolve the Complexity of the Influenza Virus Composed of Rare, Closely Related Mutant Variants

RNA viruses represent the majority of emerging and re-emerging diseases that pose a significant risk to global health – including influenza, hantaviruses, Ebola virus, and Nipah virus. When compared to DNA viruses, RNA viruses have an especially robust adaptability and evolvability due to their high mutation rates and rapid replication cycles. Development of novel medications for the prevention and treatment of these diseases requires an understanding of the mutant variants that drive an RNA-virus’ resistance mechanisms. The long read length offered by single-molecule sequencing technologies allows each mutant variant to be sequenced in a single pass. However, complete profiling of all viral genomes within a mutant spectrum is not yet possible due to the high error rate embedded in analytical protocols.

In collaboration with Alexander Artyomenko (Georgia State University), Alex Zelikovsky (Georgia State University), Nicholas Wu (The Scripps Research Institute), and Ren Sun (UCLA), Serghei Mangul and Eleazar Eskin developed a novel method for accurately reconstructing viral variants from single-molecule reads. This approach, two Single Nucleotide Variants (2SNV), tolerates the high error rate of the single molecule protocol and uses linkage between single nucleotide variations to efficiently distinguish these mutant variations from read errors.

Overview of the 2SNV method. For more information, see our book chapter.

Any method for reconstructing viral variants from single-molecule reads must overcome low volume and high error rate of sequencing data, combined with very high similarity and very low frequency of viral variants. This challenge is similar to extraction of an extremely weak signal from very noisy background with signal-to-noise ratio approaching zero. However impossible this task may seem, a satisfactory solution can be based on distinguishing randomness of the noise from systematic signal repetition. With a high sensitivity and accuracy, 2SNV is anticipated to facilitate not only viral quasispecies reconstruction, but also other biological questions that require detection of rare haplotypes such as genetic diversity in cancer cell population, and monitoring B-cell and T-cell receptor repertoire.

We present 2SNV in a chapter of conference proceedings from the 2016 RECOMB meeting. To benchmark the sensitivity of 2SNV, we performed a single-molecule sequencing experiment on a sample containing a titrated level of known viral mutant variants. We tested 2SNV on a dataset comprised of PacBio reads from 10 independent clones, ranging from 1 to 13 mutations. These 10 clones were mixed at a geometric ratio with two-fold difference in occurrence frequency for consecutive clones starting with the maximum frequency of 50% and the minimum frequency of 0.1 %. Our method is able to accurately reconstruct clone with frequency of 0.2% and distinguish clones that differed in only two nucleotides distantly located on the genome. 2SNV outperforms existing methods for full-length viral mutant reconstruction.

For more information, see our book chapter, which is available for download through Springer Publications: http://link.springer.com/chapter/10.1007%2F978-3-319-31957-5_12.

In addition, the open source implementation of 2SNV, which was developed by Alexander Artyomenko, is freely available for download at http://alan.cs.gsu.edu/NGS/?q=content/2snv.

The full citation to our paper is: 

Sorry, no publications matched your criteria.

Overview of results using the 2SNV method. (a) 2SNV (orange) outperforms existing haplotype reconstruction tools (blue) in viral variant reconstruction. Using PacBio reads from 10 IAV clones, (b) the pairwise edit distance between clones given in a heat-map and (c) occurring frequency of clone types.

Efficient and accurate multiple-phenotype regression method for high dimensional data considering population structure

Jong Wha (Joanne) Joo developed an approach to simultaneously analyze multiple phenotypes in a genome-wide association studies (GWAS) dataset. She introduces this new methodology, referred to as GAMMA (Generalized Analysis of Molecular variance for Mixed model Analysis), in a paper recently published in Genetics.

GWASs have identified many genetic variants involved in traits and development of human diseases by examining for correlation of a single phenotype and individual genotype one phenotype at a time. Since initial development of the standard GWAS approach, GWAS data collection has become larger in scale and higher in resolution. Today’s large-scale datasets include expression data and often contain thousands of phenotypes per individual. Performing the standard single-phenotype analysis on these datasets is slow and potentially fails to detect unmeasured aspects of complex biological networks.

Analyzing many phenotypes simultaneously increases the power to detect more variants and capture previously unmeasured aspects of the genome. However, standard GWAS approaches capable of simultaneously testing multiple phenotypes fail to account for the distorting effects of population structure, a phenomenon present in large cohorts that inevitably contain individuals sharing common ancestry from multiple populations. As a result, standard GWAS approaches either fail to detect true effects or produce many false positive identifications.

GAMMA is an efficient, robust approach capable of simultaneously analyzing many phenotypes while correcting for population structure. GAMMA uses the principles behind existing linear mixed models to analyze for many phenotypes simultaneously and a multiple regression technique to correct for population structure.

Joanne’s paper presents the results of testing GAMMA for accuracy in three scenarios: a simulated dataset containing population structure, a yeast dataset containing many trans-regulatory hotspots, and a complex gut microbiome dataset. In the simulated study using data implanted with true population structure effects, GAMMA accurately identifies these true effects without producing false positives. In the simulation with yeast data, GAMMA successfully corrected for the bias of technical artifacts such as batch effects and identified significant signals on most of the putative hotspots. In the third test, Joanne and her team assesses GAMMA’s ability to perform a multiple-phenotypes analysis with microbiome data. Here, results identified nine loci likely to have true biological mechanisms in the taxa.

In each scenario, results of GAMMA were compared to those of the standard t-test, EMMA, and MDMR. The standard t-test and EMMA failed to identify true variants, because the phenotypic effects in each example is smaller than the amount these methods are powered to detect. MDMR produced no significant signals in the yeast dataset and identified many false associations in the simulated and gut microbiome datasets. Both GAMMA and MDMR have sufficient power to detect small association signals in these complex datasets, but only GAMMA successfully corrects for population structure.

This project was led by Joanne Joo and involved Eun Yong Kang and Farhad Hormozdiari. The article is available at: http://www.genetics.org/content/204/4/1379.

GAMMA was developed by Joanne Joo, Eun Yong Kang, Elin Org, Nick Furlotte, Brian Parks, Aldons J. Lusis, and Eleazar Eskin. Visit the following page to download GAMMA: http://genetics.cs.ucla.edu/GAMMA/

The full citation to our paper is:

Sorry, no publications matched your criteria.

The results of GAMMA and three standard GWAS methods applied to a simulated dataset. The x-axis shows SNP locations and the y-axis shows log10p-value of associations between each SNP and all the genes. Blue arrows show the location of the true trans-regulatory hotspots.