
Figure 1.
We just published a paper on a novel approach for assembling genomes from short read sequencing technologies which combines ideas from “genome assembly” with information from a reference genome. The current analysis methods for short read sequencing data fall into two camps. The first class of methods are de novo assembly methods. These methods utilize overlaps between sequences to “assemble” the reads into a longer genome. These methods typically utilize a construct called a de Bruijn graph constructed from the reads and then look for a Eulerian tour through this graph which represents the assembled genome. The second class of methods are resequencing methods which take advantage of the similarity of the genome being sequenced with a publicly available reference genome. These methods match each read to the reference genome and keep track of the differences between the reads and the reference. Both classes of methods have advantages and disadvantages.
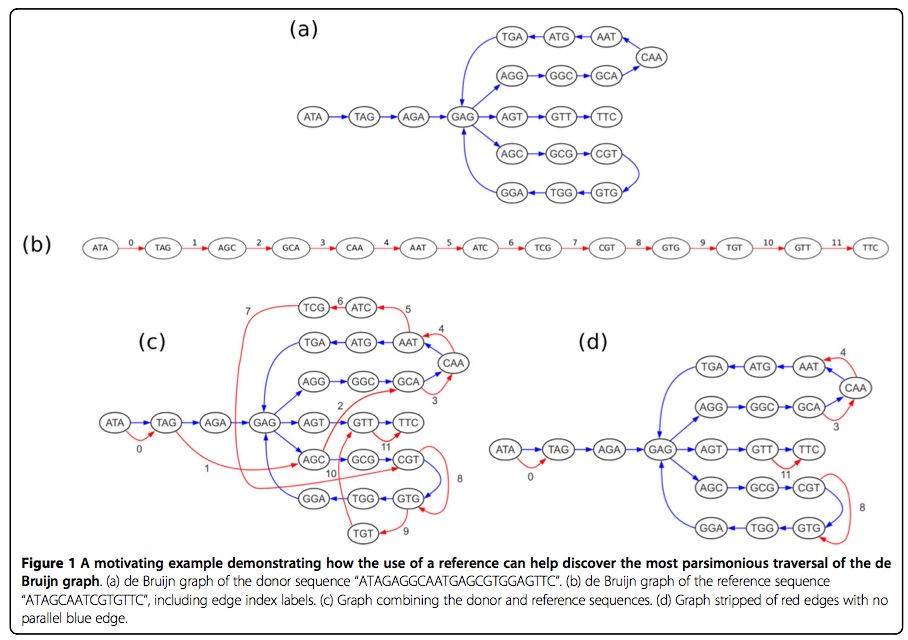
Our paper (10.1186/1471-2164-14-S1-S8) combines both frameworks and presents a method for assembly which uses the reference as an aide in the assembler. Figure 1 (link) from our paper presents an toy example of how the method works.
Method overview
As an example of how a reference sequence can aid in assembly, consider the de Bruijn graph of a donor genome “ATAGAGGCAATGAGCGTGGAGTTC” in Figure 1a. Note that this graph has two possible Eulerian tours, one in which the lower branch is taken first, and one in which the upper branch is taken first. Only one of these tours spells the original donor genome, and a de novo assembly can not distiguish between them. If, however, we are given the reference sequence “ATAGCAATCGTGTTC,” then it may be possible to discerne the correct tour. Figure 1c depicts the original de Bruijn graph augmented with the reference sequence, represented by red edges. In this new graph, it is now possible to choose the tour that is most parsimonious with the reference sequence. Stripping away the red edges that have no parallel blue edge, as shown in Figure 1d makes this more clear. We can now see that the tour following the upper branch first touches the reference edges 0, 3, 4, 8, and 11 in sequential order, with novel con- tent in between. This indicates that the donor genome spelled by this tour represents a donor with only three insertions relative to the reference. The tour following the lower branch first touches the reference edges out of order in the sequence 0-8-3-4-11, indicating three insertions as well as a translocation. By appealing to parsimony, we can therefore conclude that the tour taking the upper branch first is the more likely of the two.
This paper was joint work with Nathan Parrish (who is now a Ph.D. student at MIT) and Benny Sudakov who is in the UCLA Mathematics department.
Please any send any comments.
Full citation:
Parrish, N., Sudakov, B. & Eskin, E., 2013, Genome reassembly with high-throughput sequencing data, BMC genomics, 14(Suppl 1), p. S8.
Abstract:
MOTIVATION: Recent studies in genomics have highlighted the significance of structural variation in determining individual variation. Current methods for identifying structural variation, however, are predominantly focused on either assembling whole genomes from scratch, or identifying the relatively small changes between a genome and a reference sequence. While significant progress has been made in recent years on both de novo assembly and resequencing (read mapping) methods, few attempts have been made to bridge the gap between them. RESULTS: In this paper, we present a computational method for incorporating a reference sequence into an assembly algorithm. We propose a novel graph construction that builds upon the well-known de Bruijn graph to incorporate the reference, and describe a simple algorithm, based on iterative message passing, which uses this information to significantly improve assembly results. We validate our method by applying it to a series of 5 Mb simulation genomes derived from both mammalian and bacterial references. The results of applying our method to this simulation data are presented along with a discussion of the benefits and drawbacks of this technique.
