
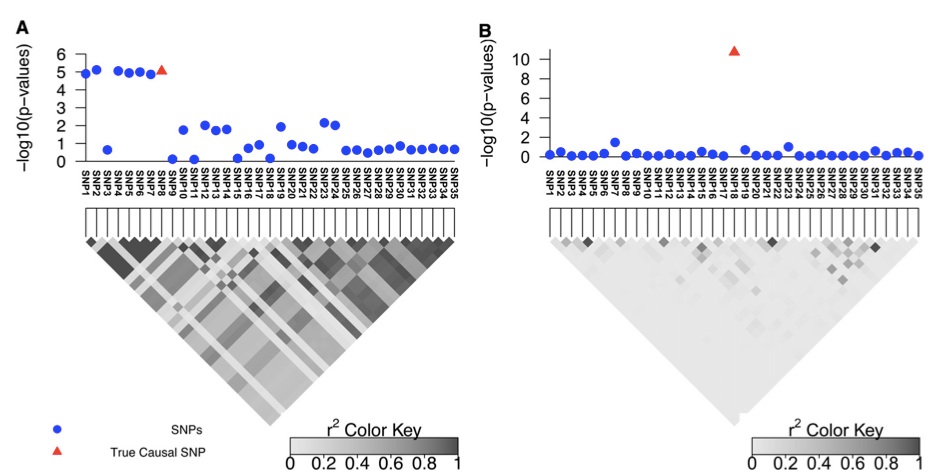
Figure 1 (A and B) Simulated data for two regions with different LD patterns that contain 35 SNPs. A and B are obtained by considering the 100 kbp upstream and downstream of rs10962894 and rs4740698, respectively, from the Wellcome Trust Case–Control Consortium study for coronary artery disease (CAD).
Our group in collaboration with our UCLA colleague Bogdan Pasaniuc’s group recently published two papers focusing on “statistical fine mapping”. We published a paper on a method called CAVIAR in the journal Genetics and Bogdan’s lab published a method called PAINTOR in PLoS Genetics. The software is available at http://genetics.cs.ucla.edu/caviar/ and http://bogdan.bioinformatics.ucla.edu/software/PAINTOR/.
Although genome-wide association studies have successfully identified thousands of regions of the genome which contain genetic variation involved in disease, only a handful of the biologically causal variants, responsible for these associations, have been successfully identified. Because of the correlation structure of genetic variants, in each region, there are many variants that are associated with disease. The process of predicting which subset of the genetic variants are actually responsible for the association is referred to as statistical mapping.
Current statistical methods for identifying causal variants at risk loci either use the strength of association signal in an iterative conditioning framework, or estimate probabilities for variants to be causal. A main drawback of existing methods is that they rely on the simplifying assumption of a single causal variant at each risk locus which is typically invalid at many risk loci. In our papers, we propose a new statistical framework that allows for the possibility of an arbitrary number of causal variants when estimating the posterior probability of a variant being causal. A direct benefit of our approach is that we predict a set of variants for each locus that under reasonable assumptions will contain all of the true causal variants with a high confidence level (e.g. 95%) even when the locus contains multiple causal variants. We use simulations to show that our approach provides 20-50% improvement in our ability to identify the causal variants compared to the existing methods at loci harboring multiple causal variants.
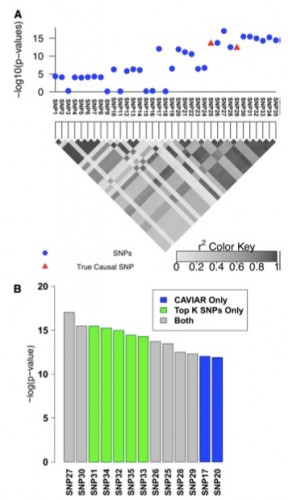
Figure 2 Simulated association with two causal SNPs. (A) The 100-kbp region around the rs10962894 SNP and simulated statistics at each SNP generated assuming two SNPs are causal. In this example SNP25 and SNP29 are considered as the causal SNPs. However, the most significant SNP is the SNP27. (B) The causal set selected by CAVIAR (our method) and the top k SNPs method. We ranked the selected SNPs based on the association statistics. The gray bars indicate the selected SNPs by both methods, the green bars indicate the selected SNPs by the top k SNPs method only, and the blue bars indicate the selected SNPs by CAVIAR only. The CAVIAR set consists of SNP17, SNP20, SNP21, SNP25, SNP26, SNP28, and SNP29. For the top k SNPs method to capture the two causal SNPs we have to set k to 11, as one of the causal SNPs is ranked 11th based on its significant score. Unfortunately, knowing the value of k beforehand is not possible. Even if the value of k is known, the causal set selected by our method excludes SNP30–SNP35 from the follow-up studies and reduces the cost of follow-up studies by 30% compared to the top k method.
From the CAVIAR paper:
Overview of statistical fine mapping
Our approach, CAVIAR, takes as input the association statistics for all of the SNPs (variants) at the locus together with the correlation structure between the variants obtained from a reference data set such as the HapMap (Gibbs et al. 2003; Frazer et al. 2007) or 1000 Genomes project (Abecasis et al. 2010) data. Using this information, our method predicts a subset of the variants that has the property that all the causal SNPs are contained in this set with the probability r (we term this set the “r causal set”). In practice we set r to values close to 100%, typically $95%, and let CAVIAR find the set with the fewest number of SNPs that contains the causal SNPs with probability at least r. The causal set can be viewed as a confidence interval. We use the causal set in the follow-up studies by validating only the SNPs that are present in the set. While in this article we discuss SNPs for simplicity, our approach can be applied to any type of genetic variants, including structural variants.
We used simulations to show the effect of LD on the resolution of fine mapping. We selected two risk loci (with large and small LD) to showcase the effect of LD on fine mapping (see Figure 1, A and B). The first region is obtained by considering 100 kbp upstream and downstream of the rs10962894 SNP from the coronary artery disease (CAD) case–control study. As shown in the Figure 1A, the correlation between the significant SNP and the neighboring SNPs is high. We simulated GWAS statistics for this region by taking advantage that the statistics follow a multivariate normal dis- tribution, as shown in Han et al. (2009) and Zaitlen et al. (2010) (see Materials and Methods). CAVIAR selects the true causal SNP, which is SNP8, together with six additional variants (Figure 1A). Thus, when following up this locus, we have only to consider these SNPs to identify the true causal SNPs. The second region showcases loci with lower LD (see Figure 1B). In this region only the true causal SNP is selected by CAVIAR (SNP18). As expected, the size of the r causal set is a function of the LD pattern in the locus and the value of r, with higher values of r resulting in larger sets (see Table S1 and Table S2).
We also showcase the scenario of multiple causal variants (see Figure 2). We simulated data as before and considered SNP25 and SNP29 as the causal SNPs. Interestingly, the most significant SNP (SNP27, see Figure 2) tags the true causal variants but it is not itself causal, making the selection based on strength of association alone under the assumption of a single causal or iterative conditioning highly suboptimal. To capture both causal SNPs at least 11 SNPs must be selected in ranking based on P-values or probabilities estimated under a single causal variant assumption. As opposed to existing approaches, CAVIAR selects both SNPs in the 95% causal set together with five additional variants. The gain in accuracy of our approach comes from accurately disregarding SNP30–SNP35 from consideration since their effects can be captured by other SNPs.
PAINTOR extended the CAVIAR model to also take into account the function of the genetic variation.
The full citations for the two papers are:
