Accounting for Population Structure in Gene-by-Environment Interactions in Genome-Wide Association Studies Using Mixed Models

This year, our group published a paper in PLOS Genetics that describes our efforts to better understand and correct for population structure when computing gene-by-environment (GEI) statistics in genome-wide association studies (GWASs). We use simulated and actual GWAS datasets to demonstrate that population structure, the relatedness of individuals within a cohort, inflates test statistics for both GEIs and genetic variants. We present a novel mixed model method capable of improving accuracy when computing GEI statistics in GWAS. This method can be efficiently applied to GWAS datasets containing thousands of individuals and hundreds of thousands of SNPs.

GWASs have discovered many genetic variants associated with complex traits and diseases, yet these genetic variants explain only a small fraction of phenotypic variance in the human genome. Other sources of phenotypic variance include discrete environmental factors and GEIs, complex interactions between an individual’s genetic material and environmental factors. Recent GEI association analyses have demonstrated the importance of GEIs in complex traits and disease development. Identification of these causal GEIs would provide insight into disease pathways, particularly the effects of environmental factors in disease risk, and guide development of novel diagnostic tools and personalized therapies.

Several methodological challenges have limited successful identification of causal GEIs. As with standard GWAS approaches, GxE GWASs are prone to produce an inflated number of associations due to population structure. Unlike standard GWASs, we lack a method designed to avoid detection of these spurious associations when computing GEI statistics. Accounting for genetic similarity with a standard GWAS approach does control inflation of test statistics for causal SNPs, but does not control inflation of associated GEIs. Simultaneously accounting for both similarities would control both types of population structure known to confound GWASs—false associations caused by SNPs under selection and those caused by the remaining SNPs.

Our linear mixed model approach introduces two random effects and takes into account two types of similarities between individuals: overlap in the genome itself and overlap in genetic expression caused by complex interactions between genes and environment. We use a pair of kinship matrices corresponding to the two types of similarity to include these two random effects in the model and correct for population structure.

In order to better understand false associations in GxE GWASs, we compare our approach to two standard approaches. We apply the three methods to two large genomic datasets, one human and one mouse, that are known to contain population structure and have many quantitative phenotypes to test effect of GEIs. We use a standard GWAS method that does not correct for population structure (defined as “OLS” in our paper) and an approach that performs population structure correction for only SNP statistics (“One RE”). The last approach is our proposed mixed model approach that uses both genetic and GxE kinship to correct for population structure on both SNP and GEI statistics (“Two RE”).

journal-pgen-1005849-g004

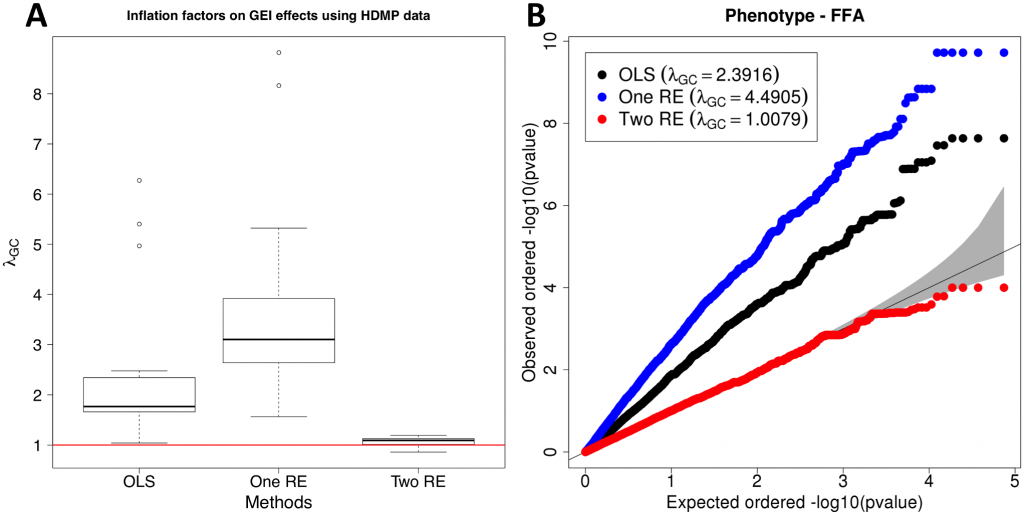
Distribution of inflation factors of GEI statistics on HMDP GxE GWAS data. (A) Inflation factor for each phenotype with no population structure correction (OLS), population structure correction for SNP statistics (One RE), and population structure correction for both SNP and GEI statistics (Two RE). (B) QQ plot of one of the phenotypes (free fatty acids, ffa), showing the distributions of p-values of GEI statistics for the three methods.

In both datasets, even a moderate amount of population structure causes spurious GEIs when using standard approaches for identifying GEI in GWAS. While the One RE approach reduces inflation of test statistics on SNPs (see Supplement S1 Figure), it has almost the same or slightly higher inflation factors on GxE statistics when compared to OLS. Results from both datasets suggest that our approach effectively controls population structure when computing statistics for GEIs and genetic variants. We hope our method is useful advancing our understanding of how life-history influences an individual’s disease risk.

This project was led by Jae Hoon Sul and involved Michael Bilow. The article is available at: http://dx.doi.org/10.1371/journal.pgen.1005849

The full citation to our paper is: 

Sorry, no publications matched your criteria.

This approach uses our PyLMM software package available for download at: http://genetics.cs.ucla.edu/pylmm/.

Gene-Gene Interactions Detection Using a Two-stage Model

Jerry Wang and Jae Hoon Sul, two lab alumni, published a paper introducing a new a two-stage model software for detecting associations between traits and pairs of SNPs using a threshold-based efficient pairwise association approach (TEPAA).  The method is significantly faster than the traditional approach of performing an association test with all pairs of SNPs.  In the first stage, the method performs the single marker test on all individual SNPs and selects a subset of SNPs that exceed a certain SNP-specific predetermined significance threshold for further consideration. In the second stage, individual SNPs that are selected in the first stage are paired with each other, and we perform the pairwise association test on those pairs.
The key insight of the approach is that the joint distribution is derived between the association statistics of single SNP and the association statistics of pairs of SNPs. This joint distribution provides guarantees that the statistical power of our approach will closely approximate the brute force approach. Then you can accurately compute the analytical power of our two-stage model and compare it to the power of the brute force approach. (See the Figure) Hence, the method chooses as few SNPs as possible in the first stage while achieving almost the same power as the brute force approach.
The power loss region of the threshold-based efficient pairwise association approach (TEPAA). The contour lines represent the probability density function of the multivariate normal distribution (MVN).  T1(subscript) is the threshold for the first stage.  Any SNP with a higher significance than T1 will be passed on to the second stage.  T2(subscript) is the threshold for significance of the pairwise test.  The area surrounded by the red rectangle corresponds to the power loss region.

The power loss region of the threshold-based efficient pairwise association approach (TEPAA). The contour lines represent the probability density function of the multivariate normal distribution (MVN). T1(subscript) is the threshold for the first stage. Any SNP with a higher significance than T1 will be passed on to the second stage. T2(subscript) is the threshold for significance of the pairwise test. The area surrounded by the red rectangle corresponds to the power loss region.

Jerry and Jae Hoon demonstrate the utility of TEPAA applied to the Northern Finland Birth Cohort (Rantakallio, 1969; Jarvelin et al., 2004).  From their analysis, they observe that the thresholds that control the power loss of the two-stage approach depend on the minor allele frequency (MAF) of the SNPs. In particular, more common SNPs can be filtered out with less significant thresholds than rare SNPs. In order to efficiently implement TEPAA using MAF dependent thresholds for each pair, we group the SNPs into bins based on their MAFs to apply the correct thresholds to each possible pair. After disregarding rare variants with MAF <  0.05, they categorize all common SNPs into nine bins according to their MAF, with step size 0.05. Each pair of SNPs would have two thresholds, one for each SNP in the first stage.  We precompute the first-stage thresholds for each combination of two MAFs in order to achieve 1% power loss,while achieving high cost savings. We sort the SNPs within each bin by their association statistics and use binary search to rapidly obtain the set of SNPs above a single threshold to efficiently implement the first stage of our method.

Read our full paper here:

Sorry, no publications matched your criteria.

Mixed Models and Confounding Factors Talk @ Simons Institute

mouse-phylogeny-slideI recently gave a talk on mixed models and confounding factors which is a long time interest of our research group at a workshop which is part of the Evolutionary Biology and the Theory of Computing program which was held at the Simons Institute on the UC Berkeley Campus. The talk was held on February 21st. This talk spans many years of work in our group including work by Hyun Min Kang (now at Michigan), Noah Zaitlen (now at UCSF), and Jimmie Ye (now at Harvard) as well as a sneak peak at very recent work by Joanne Joo, Jae-Hoon Sul and Buhm Han.

The video of the talk is available here and is also on our YouTube Channel ZarlabUCLA.

The papers which are covered in the talk include the EMMA, EMMAX and ICE papers published in 2008 as well as a very new paper that should be coming out soon. The key papers from the talk are:

Sorry, no publications matched your criteria.