ForestPMPlot: A Flexible Tool for Visualizing Heterogeneity Between Studies in Meta-analysis

Our group recently published a paper in G3 that presents a new method for interpreting meta-analysis of genomic studies. Our software, called ForestPMPlot, is a free, open-source, python-interfaced R package tool available for download from ZarLab Software. In our article, we demonstrate how ForestPMPlot facilitates interpretation of meta-analysis results by producing a plot that visualizes the heterogeneous genetic effects on the phenotype in different study conditions. We show an example analysis where our visualization framework leads to plausible interpretations of gene-by-environment interaction and multiple tissue eQTL, which would not have been straightforward with the traditional framework.

Meta-analysis has become a popular tool for increasing power in genetic association studies, yet it remains a methodological challenge. Genetic association studies can differ from each other in terms of environmental conditions, study design, population types and sizes, statistical noise, and analytical use of covariates. These factors produce different effect sizes between studies, a phenomenon called between-study heterogeneity. Correctly interpreting and accounting for heterogeneity in genetic association studies would give us a more accurate model of the true effects genetic variants have on traits under specific conditions.

Compared to traditional forest plotting techniques, ForestPMPlot visualizes a broader depth of information useful to interpretation of meta-analysis results. Specifically, our tool helps visualize differences in the effect sizes of genetic association studies and clarify why such studies exhibit heterogeneity for a particular phenotype and locus pair under different conditions. To distinguish studies with an effect from studies without an effect, we use the m-value framework. The m-value (Han and Eskin 2012; Kang et al. 2014) is the posterior probability that the effect exists in each study. In our paper, we explain how to compute an m-value and propose using the PM-plot framework (Han and Eskin 2012) to plot the P-values and m-values of each study together. The PM-Plot visualizes the relationship between m-values and P-values in a two-dimensional space, allowing a researcher to easily distinguish which study is predicted to have an effect, and which study is predicted not to have an effect.

We applied ForestPMPlot to a GWAS meta-analysis of 17 HDL mouse studies that have different environmental conditions, such as diet (e.g., high fat/low fat), and genetic knockouts, including homozygous deficiency in leptin receptor (db/db), LDL receptor knockouts, and Apoe gene knockouts. Here, we observe that two confidence intervals of effect estimates overlap each other when only considering the effect size estimates in forest plot format. This result is ambiguous if the observed heterogeneity is a result of stochastic errors. However, in the PM-Plot, we observe that the posterior probabilities are well segregated for these two studies (m-value: 0.93 vs. 0.03), allowing us to hypothesize that the SNP effects on HDL in these strains under the Western diet condition can be interacting with sex.

ForestPMPlot

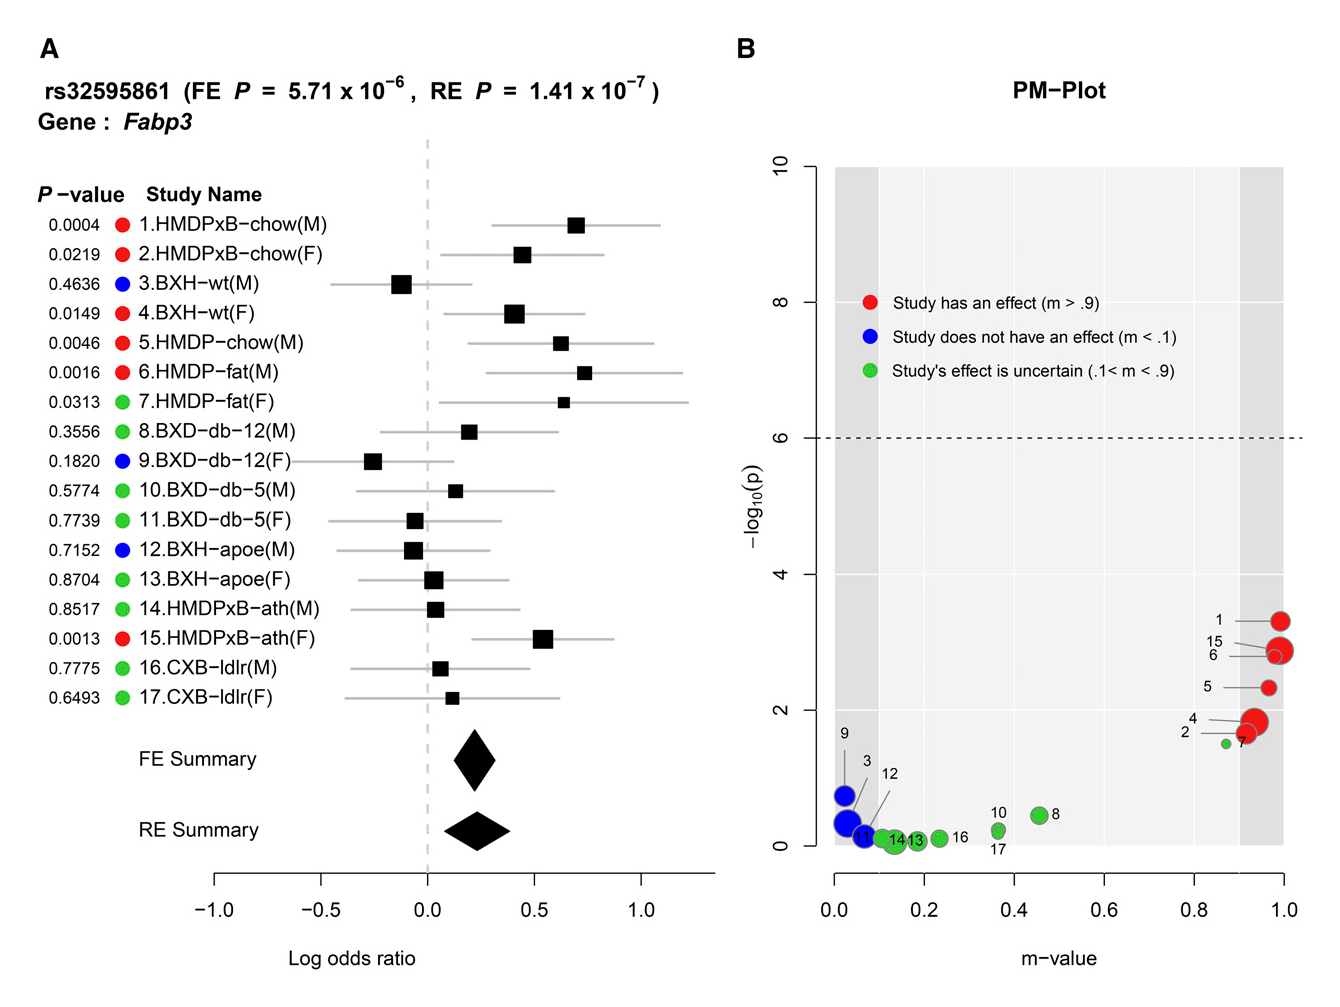
Seventeen mouse HDL studies with various environmental/genetic conditions are combined in this meta-analysis. (A) Forest plot and (B) PM-plot for rs32595861 locus (Fabp3 gene) analyzing data from the Kang et al. (2014) study.


We continue to develop new applications for ForestPMPlot, and we hope that our tool will facilitate more accurate interpretations of meta-analysis in future genetic association research.

ForestPMPlot was developed by Eun Yong Kang and Yurang Park. The article is available at: https://www.ncbi.nlm.nih.gov/pmc/articles/PMC4938634/.

Visit the following page to download ForestPMPlot: http://genetics.cs.ucla.edu/meta_jemdoc/

The full citation to our paper is: 

Sorry, no publications matched your criteria.


This paper describes methods implemented based on research originally published by this group: 

Sorry, no publications matched your criteria.

We discussed these methods and papers in a 2013 blog post: http://www.zarlab.xyz/heterogeneity-and-meta-analysis/

Imputing Phenotypes for Genome-wide Association Studies

Image

Pairwise correlation between each phenotype pair in the NFBC dataset.

In genome-wide association studies (GWAS), investigators identify variants that are significantly associated with the phenotype by collecting and performing statistical tests on genotypes and phenotypes from a set of individuals. Recently, GWAS samples have increased in size to include tens or hundreds of thousands of variants. Studies working with such large datasets have recently discovered hundreds of variants involved in multiple common diseases (Schunkert et al. 2011; Voight et al. 2010). For the most part, identified variants have very small effect sizes, suggesting that larger association studies are capable of implicating more variants.

Increasing the size of GWAS samples is a shared goal among bioinformatics researchers. Unfortunately, some phenotypes are either logistically difficult or very expensive to collect. For these phenotypes, it is impractical to perform GWAS with tens or hundreds of thousands of individuals. Examples of these difficult-to-collect phenotypes include those that require obtaining an inaccessible tissue (such as brain expression), using a complex intervention (such as a response to diet), and re-contacting individuals simply because they were unmeasured in the original cohort. For these phenotypes, an investigator finds it difficult to collect samples large enough to discover variants with small effect sizes. As a result, it is unlikely that GWAS will perform effectively on these phenotypes.

To address this issue, we developed a novel approach we call phenotype imputation. In our method, we estimate and leverage the correlation structure between multiple phenotypes to impute the uncollected phenotype. A paper presenting our approach was accepted by and is in press with the American Journal of Human Genetics.

In order to leverage the correlation structure between multiple phenotypes, we first estimate the correlation structure from a complete dataset that includes all phenotypes. We then use the conditional distribution based on the multivariate normal (MVN) statistical framework to impute the uncollected phenotypes in an incomplete dataset. Our approach uses only phenotypic—not genetic—information, enabling subsequent use of these imputed phenotypes for association testing without incurring data re-use. For GWAS including both complete and incomplete datasets, we provide an optimal meta-analysis strategy that accounts for imputation uncertainties by combining association results from both collected and imputed phenotypes. Further, our paper demonstrates that phenotype imputation can be performed using summary statistics. This result makes our method applicable to datasets where we only have access to the summary statistics and not the raw genotypes and phenotypes.

In our forthcoming AJHG paper, we use the Northern Finland Birth Cohort (NFBC) data to assess the performance of our novel method. The NFBC dataset consists of 10 phenotypes collected from 5,327 individuals. The 10 phenotypes are triglycerides (TG), highdensity lipoproteins (HDL), low-density lipoproteins (LDL), glucose (GLU), insulin (INS), body mass index (BMI), C-reactive protein (CRP) as a measure of inflammation, systolic blood pressure (SBP), diastolic blood pressure (DBP), and height. The genotype data consists of 331,476 SNPs.

Imputing the TG, BMI, and SBP phenotypes enable us to recover most of the significantly associated loci in the original data at the nominal significance level, as shown in the above figure. This result demonstrates that the imputed phenotype can effectively be used for replication purposes, even though it might not provide sufficient power for discovery purposes due to imputation uncertainties.

Our approach allows us to know the exact distribution of the imputed phenotype due to our parametric assumptions. We can directly use the mean value of this distribution as the imputed value. Furthermore, we utilize the variance of the missing phenotype in our analysis of the statistical power. The primary advantage of our framework is that it increases the power of GWASs on phenotypes that are difficult to collect. Analytical power computation is provided that allows investigators to determine the benefit of the imputation for a given dataset prospectively. Another advantage of this method is that it allows the use of summary statistics when the raw genotypes are not available.

This project was led by Farhad Hormozdiari and involved Michael Bilow. The article is available at: http://dx.doi.org/10.1016/j.ajhg.2016.04.013.

The full citation to our paper is:

Sorry, no publications matched your criteria.

Multiple testing correction in linear mixed models

Our group recently published a new paper on multiple testing applied to genetic studies with population structure.  This project was led by Jong Wha (Joanne) Joo and also involved Farhad Hormozdiari.  The project was joint with Buhm Han’s group.  The approach built upon Buhm Han’s previous work SLIDE (Han et al. 2009; Han and Eskin 2012).
 
Genome-wide association studies (GWAS) have discovered many variants that are associated with complex traits in the human genome. In GWAS, researchers collect both phenotypic information and genetic information on variants spread through the genome from a population. In order to identify the set of variants associated with a trait of interest, we assess correlations between the phenotype and the genetic information at each variant, which we call the genotype. GWAS are now routinely performed on tens of thousands of individuals—and millions of genetic variants.
 
GWAS methodology must address specific problems that are tied to this exceptionally large scale of analysis. One major challenge in GWAS is multiple hypothesis testing. In routine analyses, the significance of hypothesis testing is assessed using the p value as a per-marker threshold. However, GWAS involves computing up to millions of statistical tests in a single study. When using traditional association study techniques, multiple hypothesis testing can generate false positives or spurious associations, and p value threshold for significance must be adjusted to control the overall false positive rate.
Several approaches are useful in correcting these potential pitfalls, including Bonferroni correction and permutation test.
 
Recently, researchers have accepted the linear mixed model (LMM) as standard practice for performing GWAS. The LMM can address two important challenges in GWAS: population structure and insufficient power. Population structure refers to the complex relatedness structure among individuals, which can drive errors in data reporting such as false positives. In many cases, LMM approaches can increase the statistical power and avoid generating false positives by explicitly modeling the population structure’s genetic relationships. Nonetheless, multiple hypothesis testing with LMM approaches may generate some errors of association. Unfortunately, the current approaches for multiple hypothesis testing correction cannot be applied to LMM.  This is because population structure actually affects the correlation structure of the statistics as we show in the paper.
 
To address this issue, we developed the first gold standard approach for multiple hypothesis testing correction in LMM. This method, called multiple testing in transformed space (MultiTrans), can efficiently correct for multiple testing in LMM approaches. MultiTrans is a parametric bootstrapping resampling approach that is the equivalent of the permutation test. Specifically, our approach samples randomized null phenotypes from the distribution fitted by LMM.
 
Straightforward parametric bootstrapping where phenotypes are sampled is prohibitively computationally expensive.  MultiTrans instead utilizes   a Multivariate Normal Distribution to directly samples the association statistics.  The figure shows an overview of our methodology.
figure-overview
The full citation to our paper is:

Sorry, no publications matched your criteria.


Multiple hypothesis testing is an essential step in GWAS analysis. The correct per-marker threshold differs as a function of species, marker densities, genetic relatedness, and trait heritability—and no previous multiple testing correction methods can comprehensively account for these factors. The method we developed to address this issue, MultiTrans, is an efficient and accurate multiple testing correction approach for LMM. Our method (a) performs a unique transformation of genotype data to account for actual genetic relatedness and heritability under LMM approaches, and (b) efficiently utilizes the multivariate normal distribution. Using MultiTrans, we accurately estimated per-marker thresholds in mouse, yeast, and human datasets—while reducing computation time from months to hours.