HapIso: An Accurate Method for the Haplotype-Specific Isoforms Reconstruction from Long Single-Molecule Reads

Recent advances in RNA sequencing technology can generate deep coverage data containing millions of reads. RNA-Seq data are used to identify genetic variants and alternatively spliced isoforms, a common mechanism for diversity in a gene, that may play a role in heritable traits and diseases. Using this type of data, connections can be drawn between genetic expression and one of the two parental haplotypes identified in a diploid organism’s transcript. In other words, we can potentially identify the parent from which an individual inherited a group of genes.

These multi-kilobase reads are longer than most transcripts and enable sequencing of complete haplotype isoforms. New computational methods are required for efficient analysis of this highly complex data. In a recent paper, we present HapIso (Haplotype-specific Isoform Reconstruction), a comprehensive method that can accurately reconstruct the haplotype-specific isoforms of a diploid cell. Our software package is the first method capable of reconstructing the haplotype-specific isoforms from long single-molecule reads.

HapIso uses splice mapping of long single-molecule reads to partition reads into two parental haplotypes. The single molecule reads entirely span the RNA transcripts and bridge the single nucleotide variation (SNV) loci across a single gene. To overcome gapped coverage and splicing structures of the gene, the haplotype reconstruction procedure is applied independently to regions of contiguous coverage that have been defined as transcribed segments. Restricted reads from the transcribed regions are partitioned into two local clusters using the 2-mean clustering. Using the linkage provided by the long single-molecule reads, we connect the local clusters into two global clusters. An error-correction protocol is then applied for the reads from the same cluster.

Discriminating the long reads into parental haplotypes allows HapIso to accurately calculate allele-specific gene expression and identify imprinted genes. Additionally, it has a potential to improve detection of the effect of cis– and trans-regulatory changes on gene expression regulation. Long reads allow access to genetic variation in regions previously unreachable by short read protocols and potentially lead to new insights in disease heritability.

We applied HapIso to publicly available single-molecule RNA-Seq data from the GM12878 cell line and circular-consensus (CCS) single-molecule reads generated by Pacific Biosciences platform. Our method discovered novel SNVs in regions that were previously unreachable by standard short read protocols, 53% of which follow Mendelian inheritance. HapIso detected 921 genes with both haplotypes expressed among 9,000 expressed genes. We observed 4,140 heterozygous loci corresponding to positions with non-identical alleles among inferred haplotypes. Additionally, we can theoretically identify recombinations in the transmitted haplotypes by checking the number of recombinations in the inferred haplotypes.

The open source Python implementation of HapIso was developed by Serghei Mangul and Harry (Taegyun) Yang, and the software package is freely available for download at https://github.com/smangul1/HapIso/.

This paper appears in Proceedings of the International Symposium on Bioinformatics Research and Applications (ISBRA-2016), which can be downloaded here: http://link.springer.com/chapter/10.1007%2F978-3-319-38782-6_7

Serghei Mangul and Harry Yang led this project, which involved Farhad Hormozdiari. The full citation to our paper is:
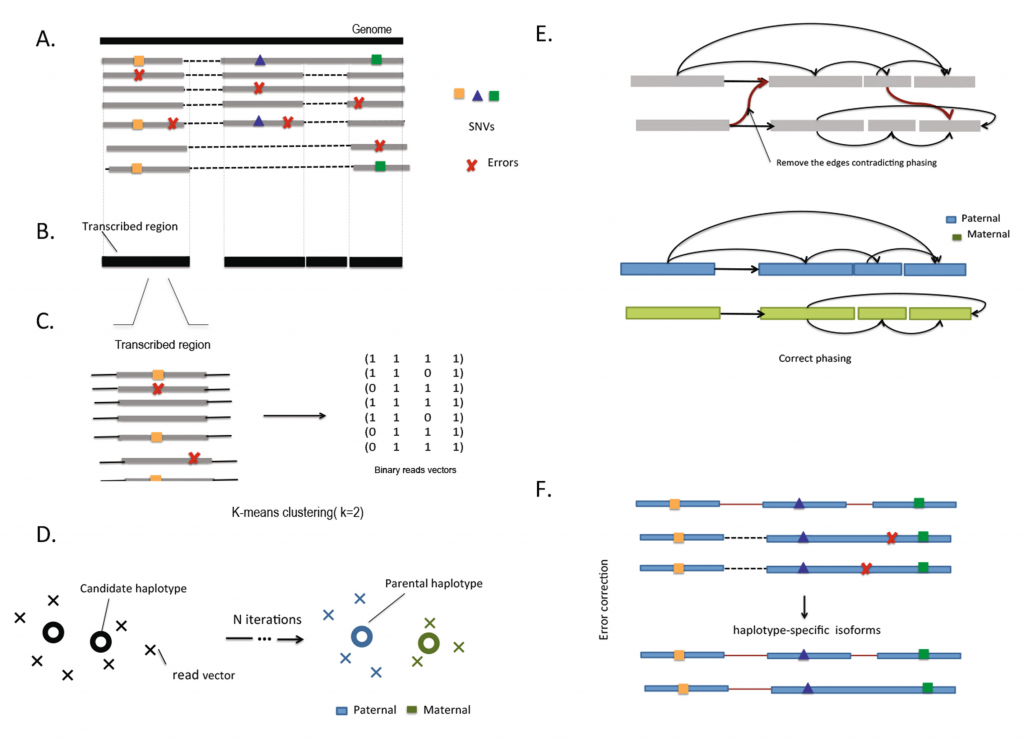
Sorry, no publications matched your criteria.

image

Overview of HapIso.

Using genomic annotations increases statistical power to detect eGenes

Our group developed a novel method for detecting eGenes, the genes whose expression levels are associated with variation at a particular genetic variant. Identification of eGenes is increasingly important to studies of expression quantitative trait loci (eQTLs), the genetic variants that affect gene expression. Mapped eGenes help guide eQTL studies of complex human disease. However, standard approaches cannot efficiently detect these complex features in today’s large genomic datasets. Func-eGene, which we describe and test in a recent Bioinformatics paper, significantly increases the statistical power of existing association study methods and detects more eGenes in comparison to standard approaches.

Standard statistical methods for classifying a gene as an eGene first perform association testing at all variants near the gene of interest, then use a permutation test to conduct multiple-testing correction for results. The permutation test effectively corrects for potential biases introduced by multiple testing and obtains a p value for each gene. However, the permutation test is computationally inefficient when processing the increasingly large sample sizes of today’s eQTL datasets and has become a computational bottleneck in eQTL studies.

Our new approach, Func-eGene, incorporates genomic annotation of variants to improve the computing power of eQTL studies. Variants located near gene transcription sites (TSSs), or near some histone modifications, often regulate gene expression. Standard approaches do not consider genomic annotations, but we found that annotation of these variants can help locate and associate more causal variants using less time and computing power. In order to do this, we expand upon the standard multithreshold association test that specifies different significance thresholds for each variant when correcting for multiple testing. Func-eGene increases power by assigning lower significance thresholds to variants that are likely to contribute to gene expression.

However, this association test still depends on the time-consuming permutation test and requires a known prior based on annotation for genetic variants. Func-eGene avoids these difficulties by reducing runtime and selecting an appropriate prior. To reduce runtime, we replace the permutation test with the Mvn-sampling procedure described in Sul et al. (2015). To find an appropriate prior, we run a grid search over possible sets of scores assigned to annotation categories. Func-eGene then seeks a set of scores that maximizes the number of eGenes and uses a cross-validation strategy to avoid data re-use and over-fitting. Thus, there are two ways to apply Func-eGene to eQTL data. Permutation Func-eGene uses the traditional permutation test to calculate the null density of the observed statistic, whereas Mvn Func-eGene relies on the Mvn-sampling procedure.

We applied our method to the liver Genotype-Tissue Expression (GTEx) dataset. We used genomic annotations of the following variants: distance from TSSs, DNase hypersensitivity sites, and six histone modifications. Notably, the distance from TSS annotation detected the highest number of candidate eGenes; using this annotation, our new method discovered 50% more candidate eGenes when compared to the standard permutation method. Our simulations show that Func-eGene successfully control the rate of false-positive associations when using either the permutation or the Mvn procedure. However, implementing Func-eGene with a traditional permutation test is inefficient. Instead, we can obtain the same results with considerably faster runtime when using Mvn sampling.

f1-large

Graphs comparing eGene detection and statistical power of permutation and mvn approaches. (a) Q–Q plots of the uniform density quantiles against the simulated eGene P-value quantiles using Func-eGene at the gene ENSG00000204219.5 under the null hypothesis. (b) Func-eGene simulated statistical power at the gene ENSG00000204219.5


This project was led by Dat Duong and involved Jennifer Zou, Farhad Hormozdiari, and Jae Hoon Sul. The article is available at: http://bioinformatics.oxfordjournals.org/content/32/12/i156.abstract

The full citation to our paper is: 

Sorry, no publications matched your criteria.

FUNC-eGene was developed by Dat Duong and is available for download at: https://github.com/datduong/FUNC-eGene


ForestPMPlot: A Flexible Tool for Visualizing Heterogeneity Between Studies in Meta-analysis

Our group recently published a paper in G3 that presents a new method for interpreting meta-analysis of genomic studies. Our software, called ForestPMPlot, is a free, open-source, python-interfaced R package tool available for download from ZarLab Software. In our article, we demonstrate how ForestPMPlot facilitates interpretation of meta-analysis results by producing a plot that visualizes the heterogeneous genetic effects on the phenotype in different study conditions. We show an example analysis where our visualization framework leads to plausible interpretations of gene-by-environment interaction and multiple tissue eQTL, which would not have been straightforward with the traditional framework.

Meta-analysis has become a popular tool for increasing power in genetic association studies, yet it remains a methodological challenge. Genetic association studies can differ from each other in terms of environmental conditions, study design, population types and sizes, statistical noise, and analytical use of covariates. These factors produce different effect sizes between studies, a phenomenon called between-study heterogeneity. Correctly interpreting and accounting for heterogeneity in genetic association studies would give us a more accurate model of the true effects genetic variants have on traits under specific conditions.

Compared to traditional forest plotting techniques, ForestPMPlot visualizes a broader depth of information useful to interpretation of meta-analysis results. Specifically, our tool helps visualize differences in the effect sizes of genetic association studies and clarify why such studies exhibit heterogeneity for a particular phenotype and locus pair under different conditions. To distinguish studies with an effect from studies without an effect, we use the m-value framework. The m-value (Han and Eskin 2012; Kang et al. 2014) is the posterior probability that the effect exists in each study. In our paper, we explain how to compute an m-value and propose using the PM-plot framework (Han and Eskin 2012) to plot the P-values and m-values of each study together. The PM-Plot visualizes the relationship between m-values and P-values in a two-dimensional space, allowing a researcher to easily distinguish which study is predicted to have an effect, and which study is predicted not to have an effect.

We applied ForestPMPlot to a GWAS meta-analysis of 17 HDL mouse studies that have different environmental conditions, such as diet (e.g., high fat/low fat), and genetic knockouts, including homozygous deficiency in leptin receptor (db/db), LDL receptor knockouts, and Apoe gene knockouts. Here, we observe that two confidence intervals of effect estimates overlap each other when only considering the effect size estimates in forest plot format. This result is ambiguous if the observed heterogeneity is a result of stochastic errors. However, in the PM-Plot, we observe that the posterior probabilities are well segregated for these two studies (m-value: 0.93 vs. 0.03), allowing us to hypothesize that the SNP effects on HDL in these strains under the Western diet condition can be interacting with sex.

ForestPMPlot

Seventeen mouse HDL studies with various environmental/genetic conditions are combined in this meta-analysis. (A) Forest plot and (B) PM-plot for rs32595861 locus (Fabp3 gene) analyzing data from the Kang et al. (2014) study.


We continue to develop new applications for ForestPMPlot, and we hope that our tool will facilitate more accurate interpretations of meta-analysis in future genetic association research.

ForestPMPlot was developed by Eun Yong Kang and Yurang Park. The article is available at: https://www.ncbi.nlm.nih.gov/pmc/articles/PMC4938634/.

Visit the following page to download ForestPMPlot: http://genetics.cs.ucla.edu/meta_jemdoc/

The full citation to our paper is: 

Sorry, no publications matched your criteria.


This paper describes methods implemented based on research originally published by this group: 

Sorry, no publications matched your criteria.

We discussed these methods and papers in a 2013 blog post: http://www.zarlab.xyz/heterogeneity-and-meta-analysis/